
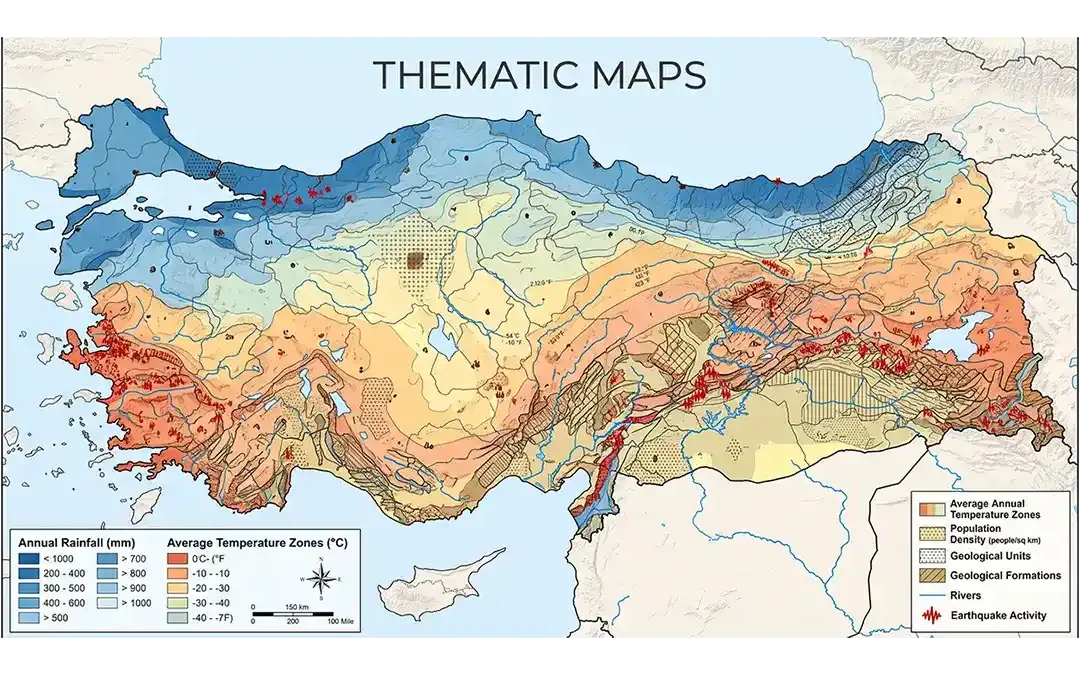
Maps help us understand places, locations, and patterns across Earth's surface. While some maps show many different geographic features, others focus on one particular subject. These focused maps are called thematic maps.
Thematic maps are designed to show the distribution, variation, or pattern of a specific topic across a geographic area. For example, a thematic map can show population density, rainfall, temperature, soil types, vegetation, mineral resources, or earthquake activity.
By using colors, symbols, lines, patterns, and other visual methods, thematic maps turn geographic data into information that is easier to understand. They are widely used in geography, geology, environmental science, urban planning, agriculture, transportation, and many other fields.
What Are Thematic Maps?
A thematic map is a map designed to show information about a specific theme or subject within a geographic area. Instead of trying to display every geographic feature, it focuses on one main type of information.
For example, a population density map may show how many people live within different areas. A rainfall map may show how precipitation varies from one region to another. Similarly, a geological map can show the distribution of different rock types.
The main purpose of a thematic map is to help users identify spatial patterns, differences, relationships, and trends.
A thematic map usually combines geographic information with a particular dataset. The geographic area provides the location, while the dataset provides the information being displayed.
For example, a map showing annual rainfall uses geographic locations as its spatial framework and rainfall measurements as its theme.
Main Features of Thematic Maps
Thematic maps have several features that make them useful for displaying geographic information.
Focus on a Specific Theme
The most important feature is their focus on a particular subject.
The theme may represent population, climate, geology, agriculture, land use, rainfall, income, vegetation, or another measurable characteristic.
Display Spatial Patterns
Thematic maps help users see how a particular variable changes across space.
For example, a temperature map can show areas with higher and lower temperatures. A soil map can show where different soil types occur.
Use Visual Symbols
Thematic maps use visual elements to communicate information.
These may include:
- Colors
- Lines
- Dots
- Circles
- Squares
- Patterns
- Graduated symbols
- Shading
The choice of symbol depends on the type of data being represented.
Show Geographic Variation
A thematic map can reveal differences between locations.
For example, a rainfall map may show that some regions receive much more rainfall than others. A population map may reveal areas with high population density and areas with low population density.
Often Use Statistical Data
Many thematic maps are created from numerical or statistical data.
For example, a map may use population data from different administrative areas and convert those values into different colors or symbols.
Provide a Visual Summary
Large amounts of geographic data can be difficult to understand when presented only in tables. A thematic map provides a visual summary that can make patterns easier to recognize.
Types of Thematic Maps:
There are numerous ways thematic information can be portrayed over a geographic region.
Four primary thematic map types are,
- Choropleth maps,
- Graduated symbol maps,
- Dot density maps, and
- Isopleth maps.
Choropleth maps:
The Choropleth map offers a definite method of portraying ratios, densities, or proportions aggregated within a specific region. It is also known as graduated color maps, depict thematic information in these bounded areas through color shading and color/value attribution.
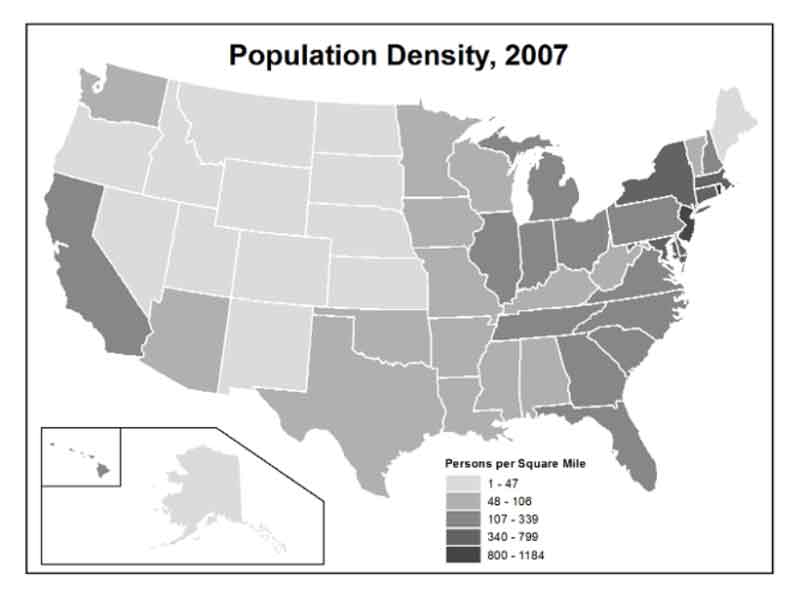
The above figure provides a good example of a choropleth map and illustrates how state median age data can be viewed in grayscale. Additionally, the map quickly offers spatial patterns associated with age and individual states that would have been nearly impossible to discern (spot) from the data alone.
A choropleth map assigns a value or range of values (called data classes) to a specific color or shading. Specifically, in the figure, the data classes were assigned to five different shades of gray. Hence, the figure has five data classes.
For best results, choropleth maps should utilize no more than eight data classes, since most individuals have a hard time distinguishing between many subtle variations in colors.
Moreover, choropleth maps best represent discrete data across defined, bounded areas. However, using too many unique values with distinct colors can cause problems. In such cases, the map becomes a geographic rainbow and loses its analytical value.
Graduated symbol maps:
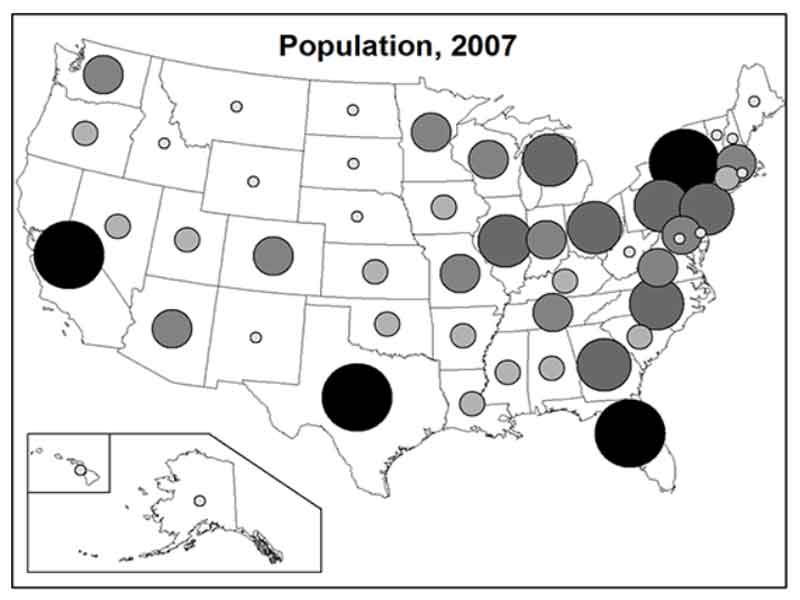
Graduated symbol maps, which are similar to choropleth maps in function but use symbols (typically a circle or dot) instead of a color fill. Graduated symbol maps are highly beneficial when indicating the quantity or magnitude of a certain phenomenon in relation to geographic positioning.
These thematic maps indicate positional data and attribute values through a common symbol of varying size. As the choropleth had a rule for its colors, graduated symbol maps have a similar rule of thumb: the smaller the symbol, the smaller the value; the larger the symbol, the larger the value.
Dot density maps:
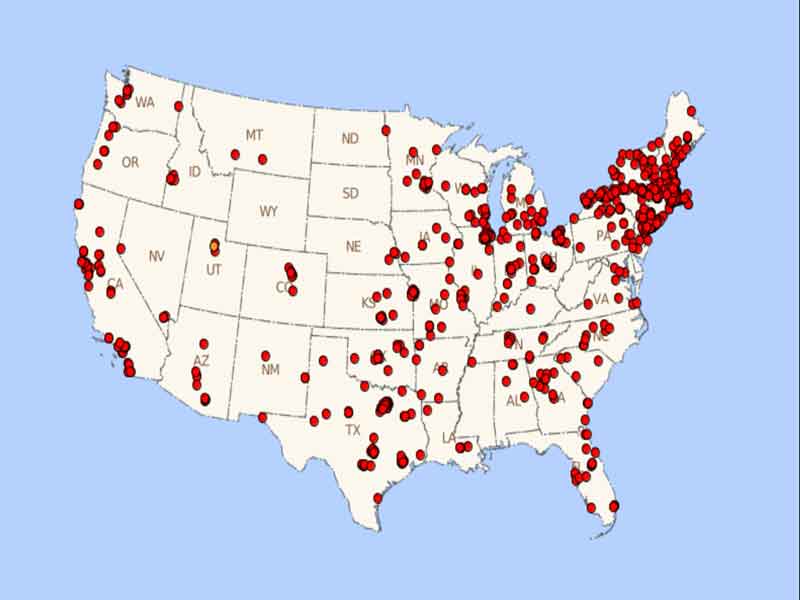
Dot density maps depict spatial densities of particular thematic elements or events. Dots on the map are always uniform in size. Unlike other thematic map types, each dot (indicator) on the map represents a defined number of thematic elements for a specific geographic position.
People sometimes find dot density maps problematic when trying to understand exact numbers or precise coverage. However, despite these few limitations, dot density maps provide an excellent way to depict attribute densities across a geographic region.
They are simple to understand and effectively represent concentration patterns and spatial trends across the entire mapped terrain.
Isopleth maps:
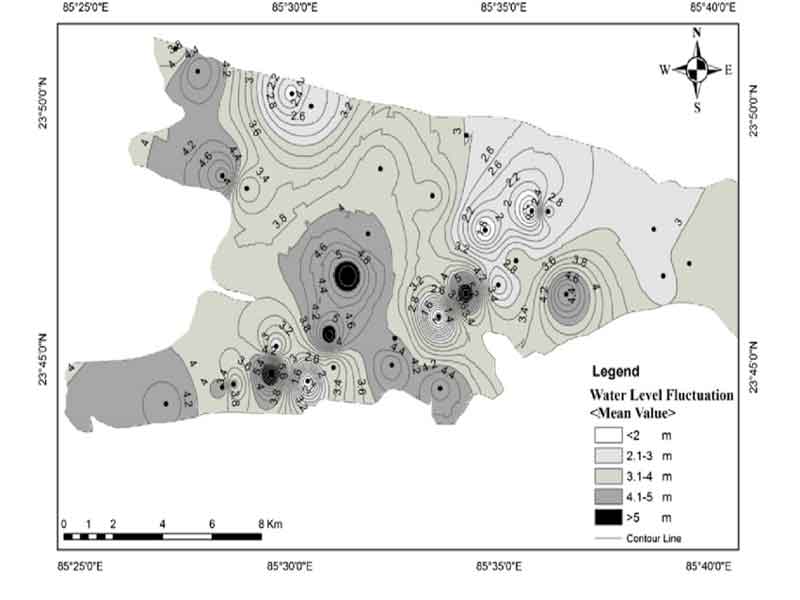
Isopleth maps visually depict continuous or nearly continuous data in contiguous patterns of color or shading. Like choropleth maps, data classes break down values and represent them with a color ramp (or user-defined ramps).
Isopleth maps connect the same data classes together with lines that form the perimeter of the same data class areas over the geographic region. The map resulting from these areas of the same value presents a sophisticated view of the spatial patterns in the region and helps define regional trends.
Isopleth mapping can also depict a variable data feature within a thematic map or as part of a topographic map (isoline).
How Do Thematic Maps Work?
Thematic maps work by connecting geographic locations with specific data. The map uses visual methods to represent differences in that data from one location to another.
The process usually begins with collecting reliable geographic data.
Step 1: Select a Theme
First, the mapmaker decides what subject the map will represent.
The theme could be:
- Population
- Rainfall
- Temperature
- Soil
- Vegetation
- Earthquake activity
- Mineral resources
- Land use
A clear theme helps determine what data should be collected and how it should be displayed.
Step 2: Collect Geographic Data
Next, relevant data is collected for different locations. For example, a rainfall map may require rainfall measurements from weather stations across a region. The quality of the thematic map depends heavily on the quality and accuracy of the data.
Step 3: Organize the Data
The collected information is organized according to geographic locations. Depending on the map type, data may be grouped by countries, states, districts, grid cells, points, or other geographic units.
Step 4: Choose a Mapping Method
The mapmaker then selects a suitable thematic mapping technique.
For example:
- A choropleth map can show values by geographic areas.
- A dot density map can show the distribution of a feature using dots.
- An isoline map can show continuous values using lines.
- A proportional symbol map can show quantities using symbols of different sizes.
Step 5: Apply Visual Symbols
Colors, lines, dots, or symbols are used to represent the data. For example, darker shades may represent higher values, while lighter shades may represent lower values. However, the meaning always depends on the map's legend.
Step 6: Add Map Elements
Finally, the mapmaker adds important components such as a title, legend, scale, and geographic reference information. The finished map allows users to examine the spatial distribution of the selected theme.
Components of a Thematic Map
A well-designed thematic map contains several important components. These elements help users understand what the map represents and how to interpret it.
Title
The title tells the reader what the map shows. A good title should be clear and specific. For example, “Annual Rainfall Distribution of Bangladesh” is more informative than simply using the word “Rainfall.”
Legend
The legend explains the colors, symbols, patterns, and other visual elements used on the map. Without a legend, many thematic maps would be difficult to interpret.
Scale
The scale shows the relationship between distances on the map and actual distances on Earth. It can be represented as a ratio, written statement, or graphic scale.
Direction
A north arrow or other directional indicator can help users understand geographic orientation. Not every thematic map needs a prominent north arrow, but it can be useful depending on the map's purpose.
Geographic Base
The map needs a geographic framework that helps users identify locations.
This may include:
- Country boundaries
- Rivers
- Coastlines
- Cities
- Roads
- Administrative boundaries
The geographic base should support the theme without distracting from it.
Symbols and Colors
Symbols and colors are central to thematic mapping. Their meaning should be clear and consistent so users can understand the information correctly.
Data Source
A good thematic map should identify where its data came from. A data source improves transparency and helps users evaluate the reliability of the information.
Date or Time Period
Some geographic variables change over time. Therefore, including the date or time period is important for maps showing population, temperature, rainfall, land use, or other changing information.
Uses of Thematic Maps
Thematic maps are used in many areas because they make complex geographic information easier to visualize.
Population Studies
Population maps can show population density, population distribution, growth, age groups, or other demographic characteristics.
Climate and Weather
Thematic maps can show rainfall, temperature, pressure, climate zones, drought conditions, and other environmental variables.
Agriculture
Farmers, planners, and researchers can use thematic maps to understand soil types, crop distribution, irrigation conditions, and agricultural land use.
Geology
Geologists use thematic maps to represent geological information such as rock distribution, mineral resources, faults, geological structures, and other Earth features.
Natural Hazards
Thematic maps can show the distribution or risk of natural hazards.
Examples include:
- Earthquake hazards
- Flood risk
- Landslide susceptibility
- Drought
- Volcanic hazards
- Wildfire risk
Urban Planning
Urban planners can use thematic maps to examine population density, land use, transportation, infrastructure, housing, and other urban characteristics.
Environmental Studies
Environmental scientists use thematic maps to study vegetation, forests, wetlands, pollution, habitat distribution, and land-cover changes.
Transportation
Flow maps and other thematic maps can represent traffic patterns, transportation routes, passenger movement, and freight movement.
Public Health
Thematic maps can show the geographic distribution of diseases, healthcare facilities, population characteristics, and other public-health information.
Thematic Maps in Geography and Earth Science
Thematic maps are especially valuable in geography and Earth science because many natural processes and geographic features vary across space.
Geological Mapping
Geologists can use thematic maps to show the distribution of rocks, minerals, faults, folds, and other geological features. For example, a geological map can help researchers understand how different rock units are distributed across a region.
Earthquake Studies
Thematic maps can display earthquake epicenters, earthquake frequency, magnitude distribution, or seismic hazard. These maps can help scientists identify areas with different levels of seismic activity.
Hydrology
Hydrologists can use thematic maps to show rainfall, groundwater conditions, drainage patterns, flood risk, and water resources.
Soil Mapping
Soil maps can show the geographic distribution of different soil types and properties. This information can support agriculture, environmental management, and land-use planning.
Mineral Resources
Thematic maps can show the locations of known mineral deposits and areas with potential mineral resources. Such maps are useful in geological exploration and resource management.
Land-Use and Land-Cover Studies
Thematic maps can show forests, agricultural land, urban areas, wetlands, water bodies, and other land-cover categories. Comparing maps from different years can also help researchers identify changes in land use.
Limitations of Thematic Maps
Although thematic maps are powerful tools, they also have limitations.
Dependence on Data Quality
A thematic map is only as reliable as the data used to create it. If the source data is incomplete, outdated, inaccurate, or biased, the map may provide a misleading picture.
Simplification of Complex Information
Maps simplify real-world conditions. A single color or symbol may represent a wide range of values. Therefore, some details can be lost during the mapping process.
Classification Problems
Many thematic maps divide continuous data into classes. The way these classes are selected can affect how users perceive patterns. For example, two maps using the same dataset but different classification methods may appear to show different spatial patterns.
Scale Limitations
A map designed for a large region may not show small local variations. Similarly, a highly detailed local map may not be suitable for understanding large-scale regional patterns.
Color Interpretation
Poor color choices can make a map difficult to read. Colors should have clear meanings and sufficient contrast. Mapmakers also need to consider readers who have color-vision deficiencies.
Risk of Misinterpretation
Users may sometimes assume that a pattern shown on a map proves a cause-and-effect relationship. However, a thematic map generally shows spatial relationships or distributions. It does not automatically explain why a pattern exists.
Thematic Maps vs. General Reference Maps
Thematic maps and general reference maps serve different purposes.
A general reference map provides information about many geographic features, while a thematic map focuses mainly on one specific subject.
| Feature | Thematic Map | General Reference Map |
|---|---|---|
| Main purpose | Shows a specific theme | Shows general geographic information |
| Focus | One or a few related variables | Many geographic features |
| Examples | Rainfall, population density, soil | Roads, cities, rivers, boundaries |
| Data emphasis | Strong emphasis on thematic data | Strong emphasis on geographic locations |
| Symbols | Often data-driven | Often standardized geographic symbols |
| Main use | Analyze spatial patterns | Find and identify locations |
For example, a road map helps users find roads and locations. In contrast, a population-density map helps users understand where population is concentrated.
Both types are useful, but they answer different geographic questions.
A thematic map is a map that focuses on a specific subject or theme and shows how that information varies across a geographic area.
Thematic maps are used to display and analyze geographic patterns such as population, rainfall, temperature, soil, land use, mineral resources, and natural hazards.
Common types include choropleth maps, dot density maps, proportional symbol maps, graduated symbol maps, isoline maps, flow maps, cartograms, and heat maps.
A map showing population density by district is an example of a thematic map. Other examples include rainfall maps, geological maps, soil maps, and earthquake hazard maps.
A thematic map focuses on a specific subject, while a general reference map shows a broad range of geographic features such as roads, rivers, cities, and boundaries.
Conclusion
Thematic maps are important tools for showing how a specific geographic variable is distributed across space. Unlike general reference maps, they focus on a particular theme, such as population, rainfall, temperature, soil, geology, land use, or natural hazards.
These maps use colors, symbols, dots, lines, patterns, and other visual methods to turn geographic data into information that is easier to understand. Different types of thematic maps are suitable for different datasets. For example, choropleth maps are useful for area-based data, while dot density maps show distributions and isoline maps represent continuous values.
Thematic maps have many applications in geography and Earth science. Geologists, hydrologists, environmental scientists, urban planners, agricultural researchers, and disaster-management professionals can use them to identify spatial patterns and support decision-making.
However, thematic maps also have limitations. Their accuracy depends on the quality of the underlying data, and choices involving scale, classification, symbols, and colors can influence how users interpret the information.
Overall, thematic maps provide a simple and effective way to understand where geographic patterns occur, how they vary from place to place, and what relationships may exist across a landscape. They are therefore an essential part of modern geography, cartography, and Earth science.