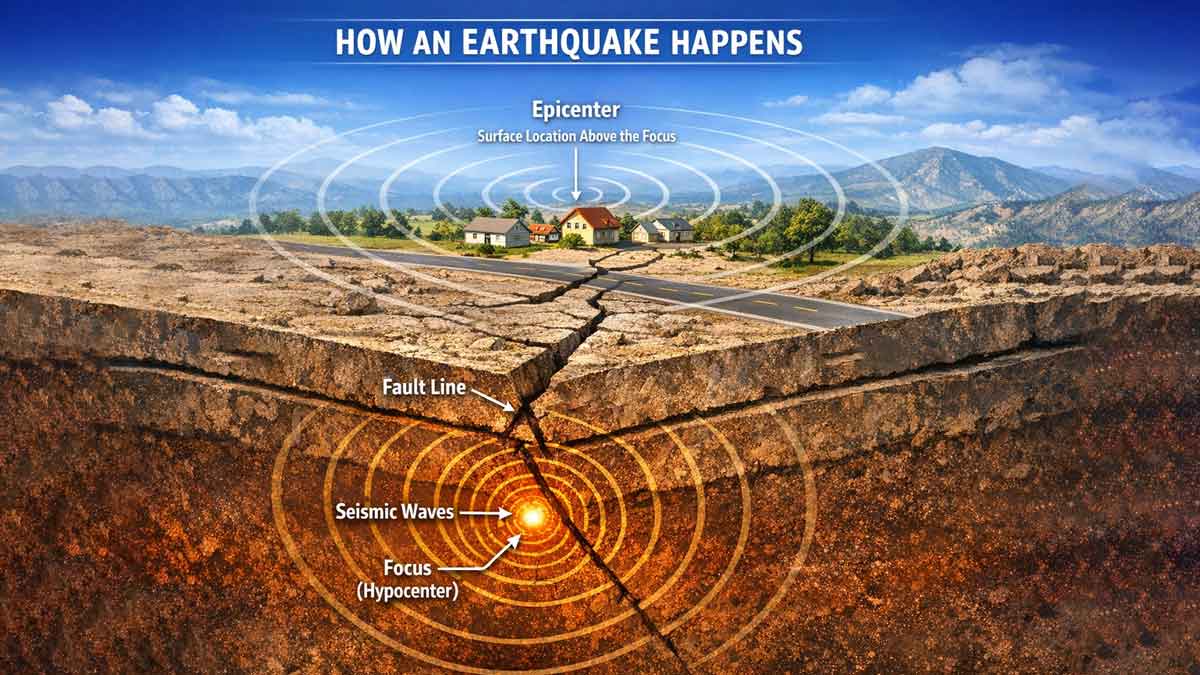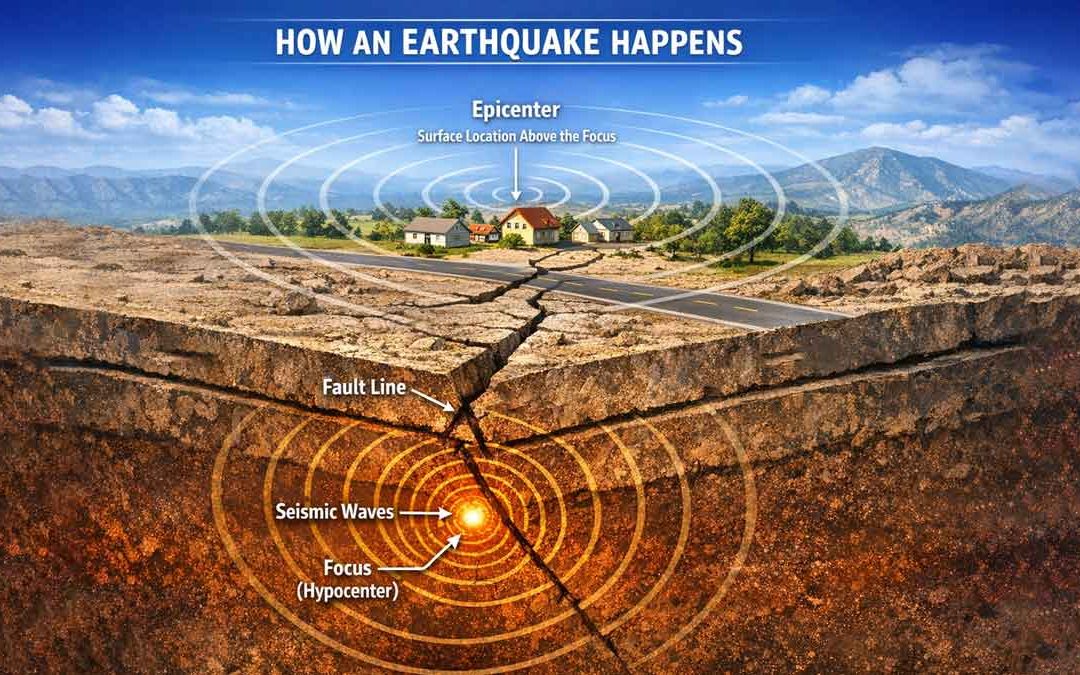
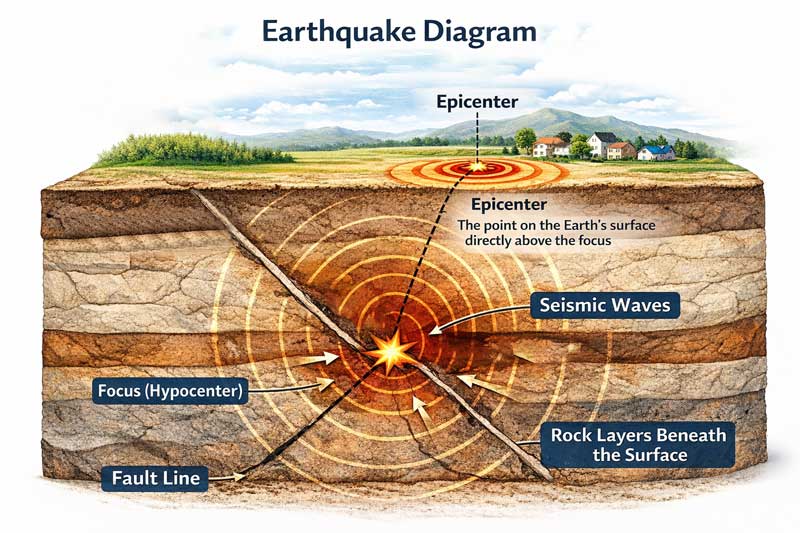
An earthquake diagram is a visual way to understand how earthquakes happen beneath the Earth’s surface. It shows key parts such as the fault line, focus, epicenter, and the movement of seismic waves.
By looking at a diagram, it becomes much easier to understand how energy is released and how it travels through the Earth.
What Does an Earthquake Diagram Show?
A typical earthquake diagram includes several important parts:
- Fault line
- Focus (hypocenter)
- Epicenter
- Seismic waves
- Rock layers beneath the surface
Each part plays a role in how an earthquake begins and spreads.
Main Parts of an Earthquake Diagram
Fault Line
The fault line is a crack in the Earth’s crust where movement occurs.
It is the place where stress builds up over time. When the rocks suddenly slip along this fault, energy is released and an earthquake occurs.
Focus (Hypocenter)
The focus is the point inside the Earth where the earthquake starts.
This is where:
- rocks break or shift
- energy is released
- seismic waves begin
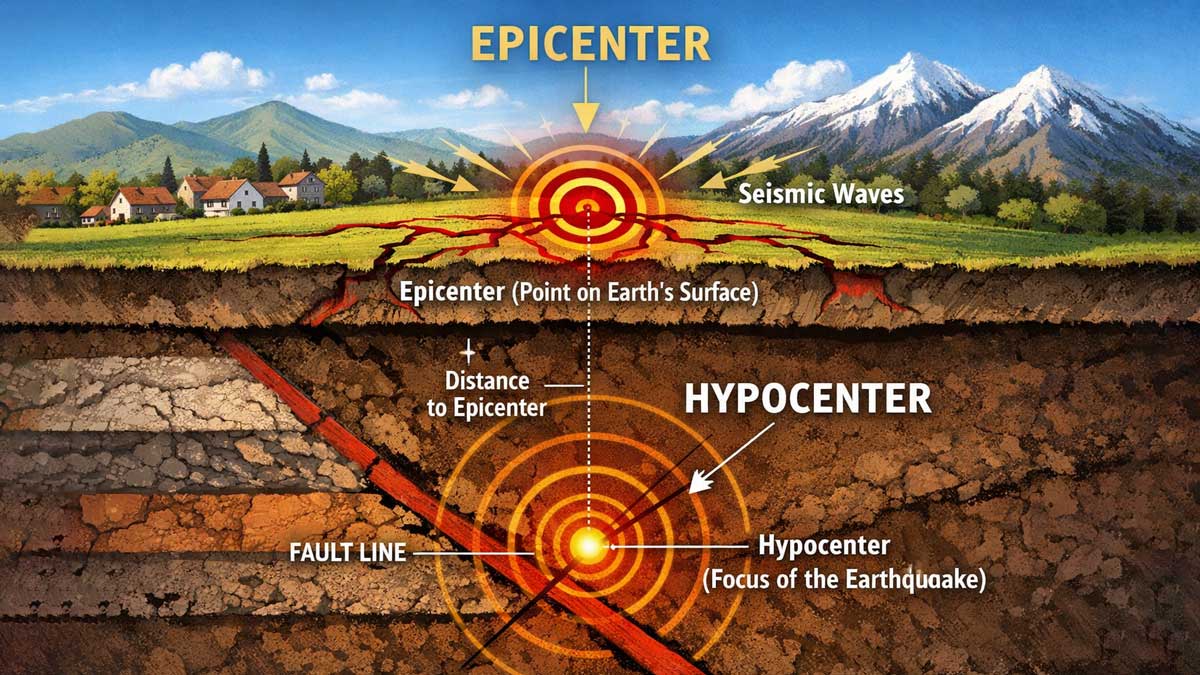
Epicenter
The epicenter is the point on the Earth’s surface directly above the focus.
This is usually the location mentioned in earthquake reports because it represents where the shaking is strongest at the surface.
learn more about epicenter vs focus.
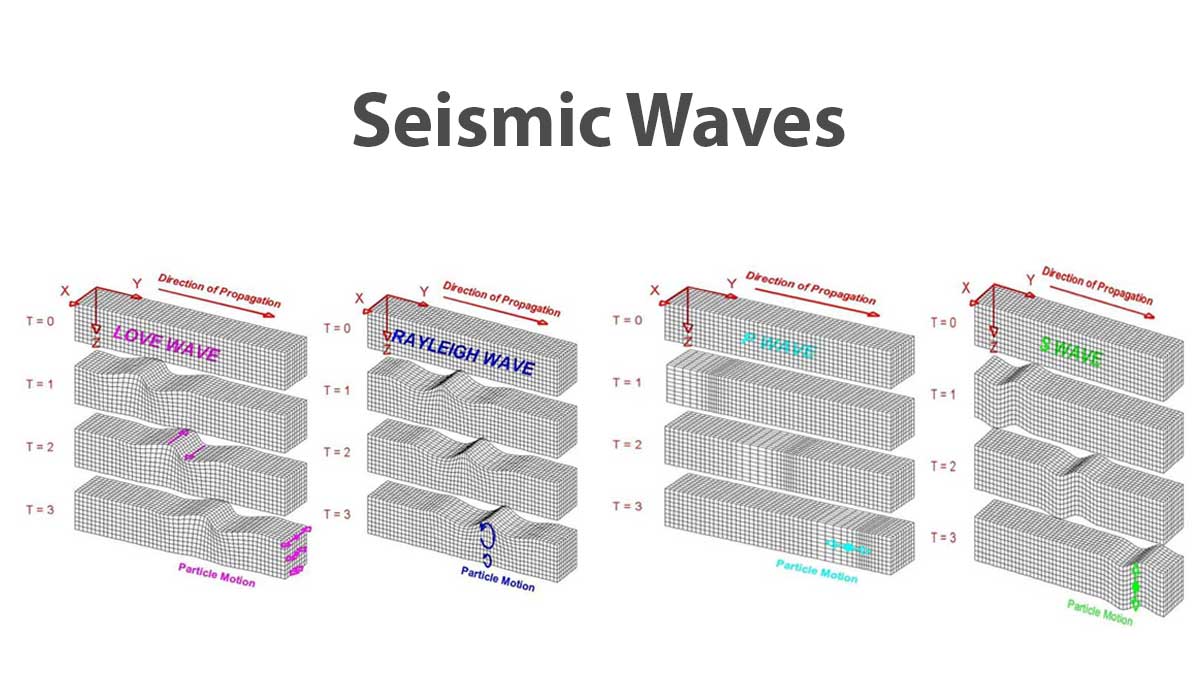
Seismic Waves
Seismic waves are the energy waves that move outward from the focus.
They travel through the Earth and along its surface, causing the ground to shake.
There are different types of waves, each moving at different speeds and causing different levels of impact.
How to Read an Earthquake Diagram
To understand an earthquake diagram:
- Start at the focus (underground origin)
- Look at the fault line (where movement happens)
- Find the epicenter (surface location)
- Follow the seismic waves spreading outward
This step-by-step view helps explain how earthquakes affect different areas.
Why Earthquake Diagrams Are Important
Diagrams help simplify complex geological processes.
They are useful for:
- students learning geology
- understanding earthquake reports
- visualizing underground activity
- improving disaster awareness
A well-labeled diagram can explain more than long text descriptions.
Simple Explanation
In simple terms:
An earthquake diagram shows:
- where the earthquake starts
- how energy moves
- where shaking is strongest
Conclusion
Earthquake diagrams provide a clear and visual way to understand how earthquakes happen. By identifying key parts like the fault, focus, and epicenter, you can better understand how energy travels through the Earth and causes ground shaking.
To gain a deeper understanding, explore related topics such as seismic waves, fault lines, and earthquake causes.
Frequently Asked Questions
An earthquake diagram is a labeled illustration that shows how an earthquake starts and spreads.
The main parts include the fault line, focus, epicenter, and seismic waves.
They help visualize how earthquakes occur and make complex concepts easier to understand.