When analyzing sediment, a percentile helps determine the grain size at a specific weight percentage. It’s found by plotting data on a cumulative curve and is essential for understanding sediment distribution.
By using histograms, probability curves, and frequency distributions, scientists can identify key percentiles, including quartiles like Q1 (25th percentile), Q2 (50th percentile or median), and Q3 (75th percentile).
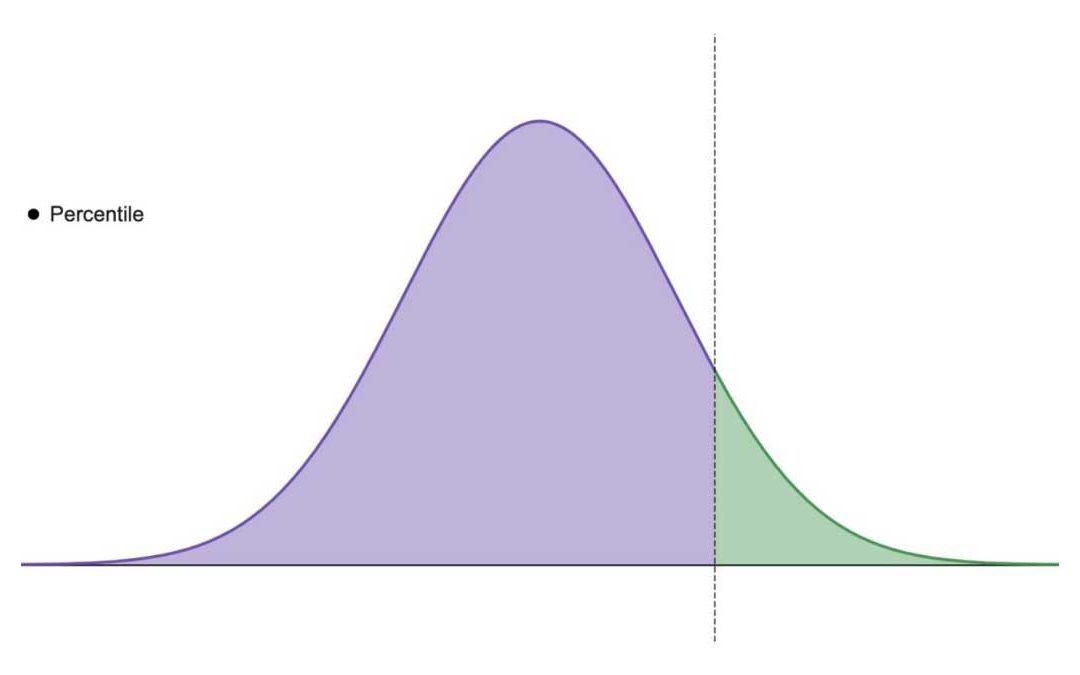
What is Percentile?
Percentile is the grain size at a given weight percentage obtained graphically from the cumulative curve.
Percentile can be obtained by:
- Plotting Histogram curve: From the weight of each class, the percent of the total is calculated, and the cumulative percent is calculated.
- Histogram of size distribution: the data can be plotted as a smooth curve if enough data are available.
- By drawing a probability curve, values for each frequency pick are read from the grain size scale.
Calculations are made by using data from the cumulative and frequency curves.
Uses of Percentile:
To calculate the statistical parameters, we read quartiles and percentiles from the cumulative curve. The latest process for calculating statistical parameters involves using percentiles.
The grain size corresponding to a given weight percent is obtained graphically from a cumulative curve. Quartiles also represent percentiles, indicating the size values at the intersection of the 25th percentile.
50,75 percent values in the cumulative curve.
25p= 1″ quartiles = Q1
50p= 2nd quartiles = Q2
75p = 3rd quartiles = Q3