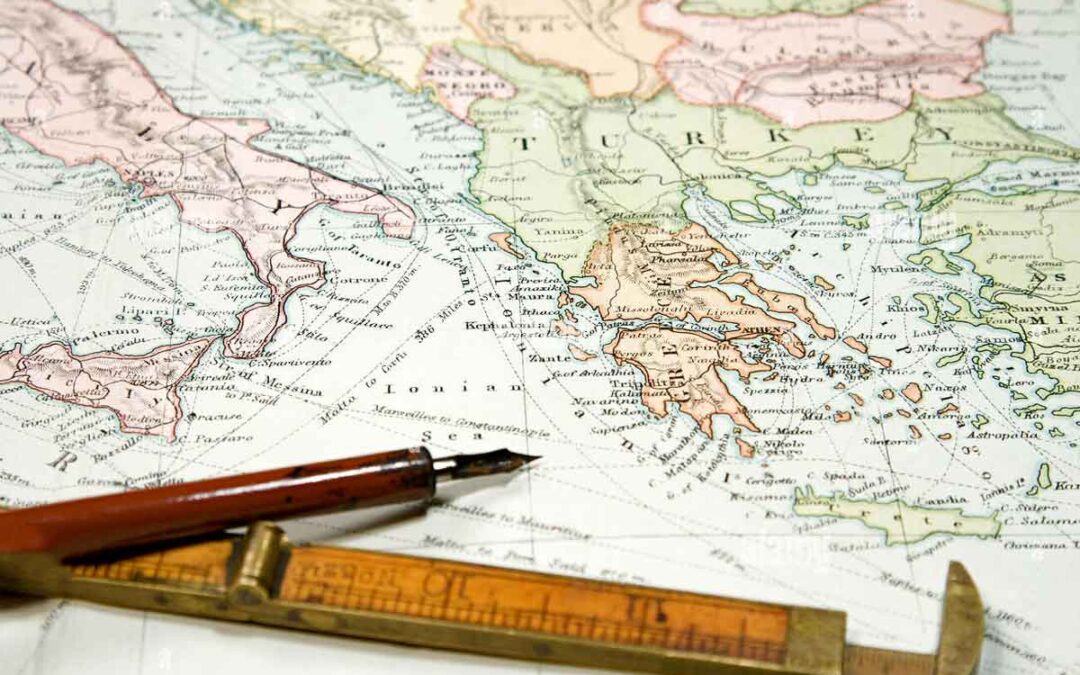
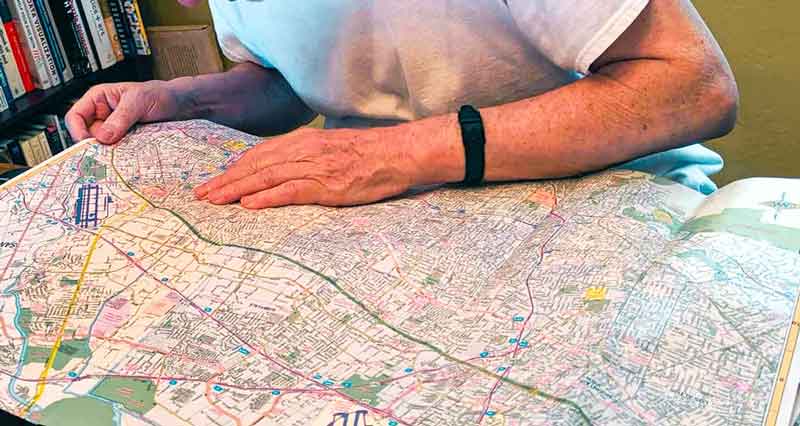
A map is a visual representation of the earth’s surface on a flat surface, showing physical, political, or other features. Map reading is the process of understanding the information on the map and how it relates to the actual ground. It’s about knowing what the symbols and lines on the map mean in real life.
Understanding Map Basics:
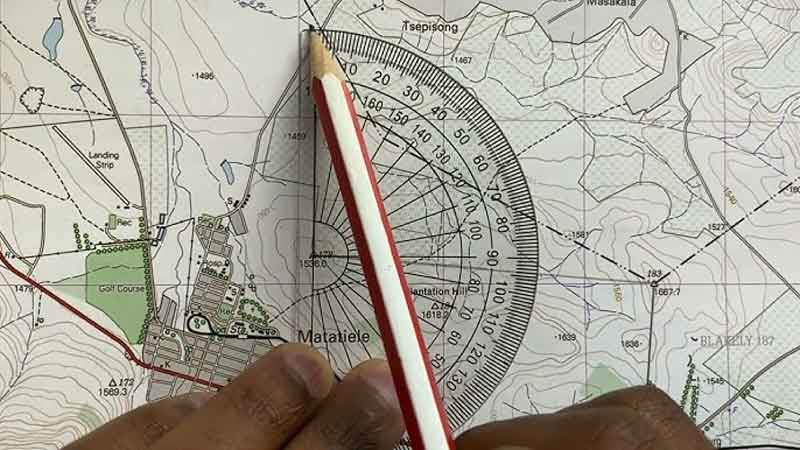
To make full use of a map, it is necessary to be able to give and read grid references, take bearings, and measure distances. Every map shows some portion of the earth’s surface on paper. This is a complex and engaging task, requiring skill and precision for three significant reasons. First, the piece of paper on which the map is to be drawn is too small in comparison to the earth’s surface.
So, when this earth’s surface is represented on paper, it must be reduced to a definite scale. Second, there are so many minor details and small features present in any landscape that no map can possibly show all of them. So, different types of maps are used to show various features.
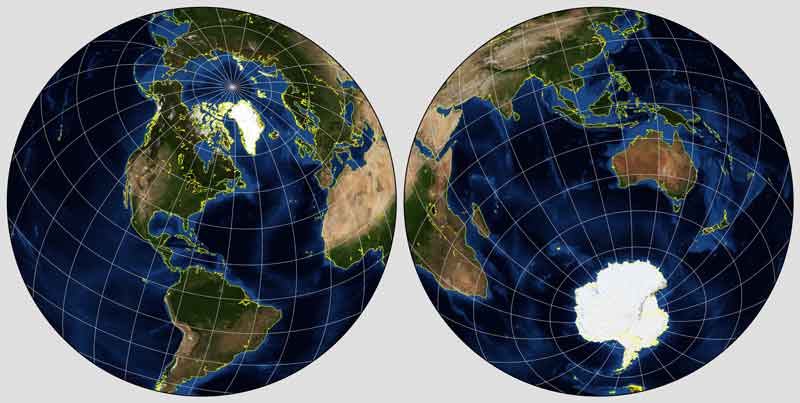
Third, the earth’s surface is curved, and it is impossible to place a curved surface on a flat surface (the piece of paper on which the map is printed) without some deformation or distortion. On almost all modern maps, the curved earth’s surface is distorted according to some definite geometric plan called projection. Understanding these projections is crucial as they are characterized by the pattern of the lines of longitude and latitude made on the map. Either or both may be straight or curved, converging or parallel.
Map Projections:
There are two basic projections:
- A conformal projection, on which the shape of any small area is correctly shown and
- An equal-area projection on which a constant scale of areas is preserved over the entire map.
The conformal projection always shows a right angle, i.e., the orthogonal intersection of any parallel (latitude) with any meridian (longitude), just as it holds for all corresponding intersections of parallel and meridians on the glove. There are various types of conformal projections: stereographic, Lambert conformal, Mercator, and transverse mercator projection.
All conformal projections suffer from severe scale changes, so areas are not correctly represented. On an equal-area projection, a small square or circle representing a given number of square miles may be moved about over the map and will delimit the same area of ground wherever it is placed. Azimuthal equal-area, sinusoidal, Mollweide’s homolographic, and homolosine projections are all equal-area projections that suffer from severe distortions of shapes.
Many map projections are neither equal-area nor conformal but have some unique and valuable properties. Two are of particular interest in the earth sciences. These are azimuthal equidistant and gnomonic projection. Maps offer a type of information that a printed word cannot. Maps are the most effective means to convey the results of your analysis. Maps may serve different purposes, such as political maps, physical maps, topographic maps, hydrographic maps, and geological maps.
Map Scale:
Map scale may be defined as the ratio of the distances between two points on a map to the actual distance it represents on the ground. There are three ways to express map scale.
Statement Scale:
It may be expressed by the two lengths, i.e., one inch to one mile. An inch on the map may also correspond to 10 inches, 1000 inches, 1,000,000 inches, or whatever unit of reduction the map maker deems desirable to show the features he wishes to portray.
Proportional or Fractional Scale:
The most common method of stating a map’s scale is proportion or fraction, which shows the relationship between map distance and ground distance.
1 Map distance
——- ———————-
24000 Ground distance
The scale written above means that one unit of distance on the map represents 24000 units of distance on the ground. It must be remembered that the distance units must be the same for both map and ground measurements. The representative fraction (RF) has the advantage of making it easy to compare scales in inches and miles with scales in centimeters and kilometers.
It is evident that a 1:250,000 map is almost. The same scale as one with an RF of 1: 253,440; that is, it is almost 1 inch to 4 miles. If one only knew that the scale was 2 centimeters to 5 kilometers, it would take quite a while to work out that it was almost the same as 1 inch to 4 miles. The larger the denominator of the RF, the smaller the scale.
Graphic Scale:
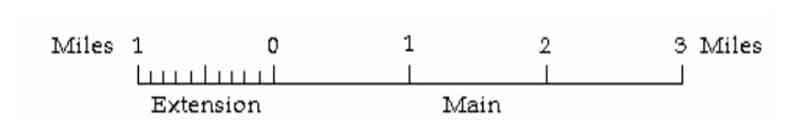
Another widespread and extremely useful way of showing the scale of a map is by a graphic scale. It is also called linear or bar scale. This is a small ruler drawn to fit the scale of the map and printed along the margin. It is used exactly like an ordinary ruler, with one exception. As shown in the diagram, the graphical scale does not have the zero point at the left end as in ordinary rulers.
Instead, the scale is divided into two sections with a zero point between them. To the right of the zero point, the scale is drawn into a few significant distance units, such as miles or thousands of feet. To the left of the zero point, on what is known as the extension, the scale is divided into fractions of one of the major units, such as tenths of hundreds of feet.
Map Scale Computation:
Sometimes, the scale of a map is stated in words; for example, three inches on the map represents two miles on the ground. A linear scale could be constructed easily based on this information, but certain computations are necessary to determine the proportional or fractional scale.
However, these computations are easy if the requirements of a correct fractional scale are kept in mind. For instance, the scale 3 inches to 2 miles can be converted to a correct RF scale as follows:
3 inches on the map represents 2 miles on the ground
or, 3 inches on the map, 2 x 63360 inches.
or, 3 inches on the map, 126,720 inches.
or, 1 inch on the map, 42,240 inches.
The correct RF scale is 1: 42,240
Map Location:
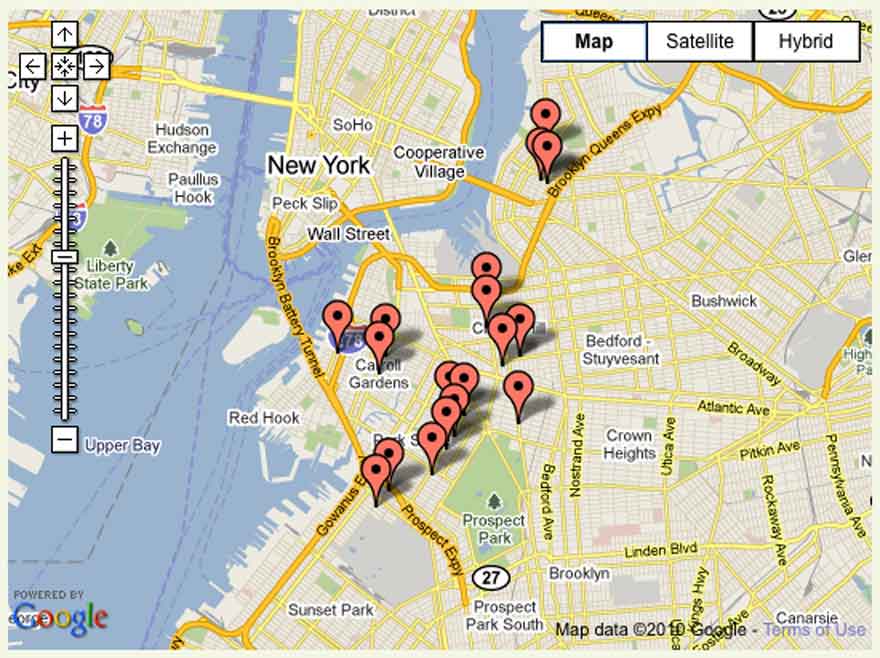
Maps are a means of recording information about parts of the earth’s surface, which is geographic information. Such information cannot be between people of different languages unless there is a universal language of maps. The location of any area is particularly important for almost all map uses.
Latitude and Longitude:
An international language of locations has been established to aid the understanding of maps. The earth’s surface has been divided into small units of area by two sets of intersecting lines, which form a grid. One set is drawn across the earth’s surface in north-south directions, from the north pole to the south pole. These lines are known as meridians of longitude.
They are numbered by degrees from 00 to 1800. The number of a given meridian is determined by the angle, measured at the earth’s center, between that meridian and the zero or prime meridian. The prime meridian passes through the Greenwich Observatory in London until they meet in 1800 at the International Date Line in the Pacific Ocean.
The lines that cross the meridians to form the grid are known as parallels of latitude. These pass around the earth in an east-west direction. A given parallel is numbered by the degree of the angle measured at the center of the earth between that parallel and the zero parallel, which is called the Equator: the parallels, therefore, number from 00 at the equator to 900 at the north-south poles.
The parallels of latitude are always a constant distance apart, as their name implies. The meridians of longitude are farthest apart, where they cross the equator and join the north and south poles. The pattern that the lines of longitude and latitude make on a map will vary with the type of geometric distortion, or projection, used to place the earth’s curved surface on the flat piece of map paper. In some predictions, the lines are straight; in others, they are curves.
It is necessary to have some means of accurately locating a map in order to discuss it and call attention to specific places. Any spot on the earth’s surface can be located by giving its latitude (either north or south) of the equator and its longitude (east or west of Greenwich).
For accurate measurements, each degree of latitude or longitude can be further subdivided into 60 equal parts called seconds. A grid is a network of north-south and east-west lines present in a map and is used to locate a point. Sometimes, on a huge-scale map, a point is located by the grid number instead of latitude and longitude.
Distance and Direction:
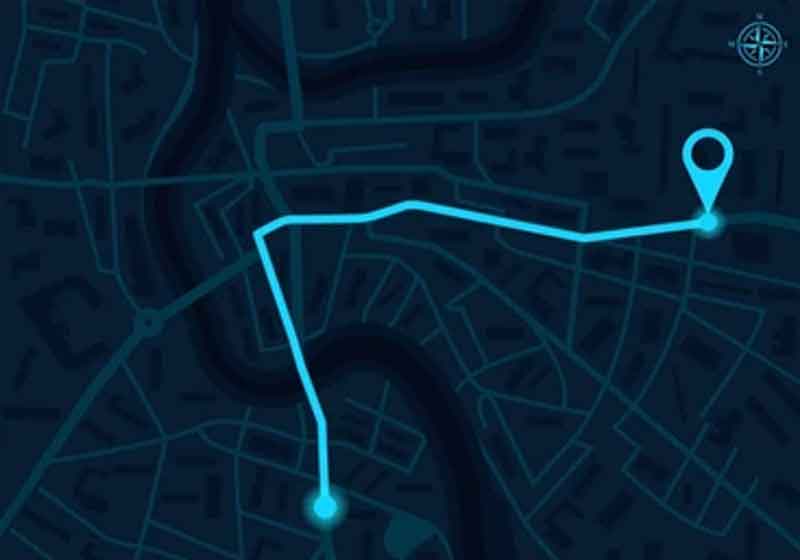
The two necessary elements of any location are distance and direction. If the scale of a map is given, distance can be measured and computed. When the distance is a straight line measurement between two points (an airline or crow flight distance), the problem is simple. Measuring the distance along a crocked road or a winding stream is a little more difficult.
Once the distance between two points has been measured, it is necessary to know in what direction one point lies from the other before the relative position of the two points is completely defined. The problem of direction measurement is complicated by the fact that there are two north directions shown on most maps: geographic north and true north.
This is the direction toward the north geographic pole, the point at which all meridians of longitude converge and meet in the northern hemisphere. Therefore, the proper north direction parallels the meridian, which passes through the measurement point.
The other north is magnetic north. This is the direction toward the north magnetic pole—the spot toward which the north-seeking needle of a compass will point if there is no local interference from magnetic ore bodies, power transmission lines, and so forth.
The magnetic north direction will almost never coincide with a meridian of longitude. Most maps are printed with a vertical line pointing toward the geographic north. Magnetic north is then usually at some angle to the vertical, either to the right or the left, depending on the location of the map area. The angle between true north and magnetic north is called the declination. There is one more north called grid north.
Map Symbols:

All features that are shown on maps are indicated by the use of symbols that represent the actual objects. Using symbols, all undesirable details can be omitted from the map, making it easier to read. A good map symbol can be easily understood by persons utilizing the map. Most symbols look like the objects they portray.
For example, a double line indicates a highway and a black square with a cross above it indicates a church. The choice of colors also has symbolic meaning. Most objects built by man are shown in black. Blue is used for water features. Vegetation (whenever shown) is indicated by green printing. Brown is used to show the topography or elevations of the land surface. In geological maps, different colors are used for different rock units.
Conclusion:
Maps are crucial in helping us understand the world around us, providing valuable insights into natural and man-made features. We can unlock a wealth of information by carefully interpreting symbols, scales, projections, and locations. Whether for navigation, scientific analysis, or understanding geographical phenomena, map reading is an essential skill that requires knowledge and practice.
Mastering the principles of map reading will enable you to navigate new terrains, solve geographic problems, and gain a deeper understanding of the complexities of the Earth’s surface. As our world evolves, maps will continue to be the foundation of our navigation and knowledge of our surroundings.