Capillary pressure:
Capillarity is the phenomenon whereby liquid is drawn up a capillary tube. It is a measurement of the force that draws a liquid up a thin tube, or capillary. It increases with decreasing tube diameter. Translated into geological terms, the capillary pressure of the reservoirs increases with decreasing pore size, specifically, pore throat diameter.
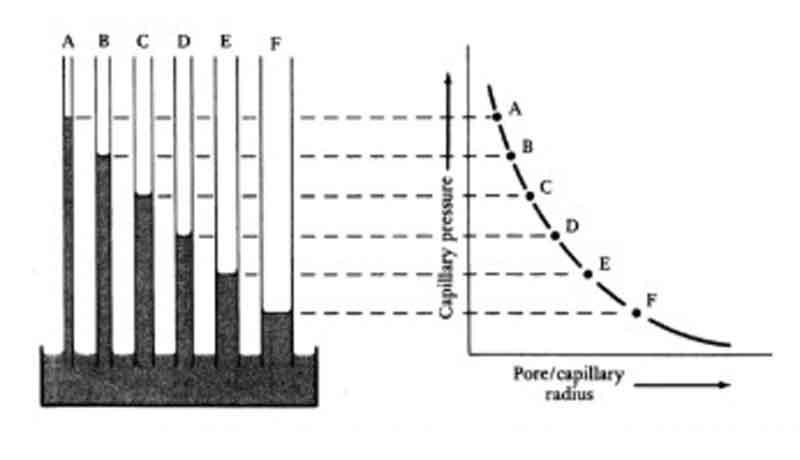
Factors Influencing Capillary Pressure:
- It can be viewed as the pressure required to drive a fluid through a pore throat and displace the pore-wetting fluid, with greater pressure being required as the pore throat becomes smaller.
- The size and distribution of pore throats within a host rock control its capillary pressure characteristics, which in turn control fluid behavior in the pore system.
- Mercury-injection capillary pressure curves, which measure capillarity, are obtained by injecting mercury into sample plugs to produce a plt of injection pressure vs mercury saturation.
- The resulting capillary pressure curves can provide qualitative assessments of reservoir rock.
Capillary Pressure Tests in Reservoirs:
- Reservoirs are commonly subjected to capillary pressure tests in which samples with 100% of the fluid of one fluid are injected with another.
- The pressure at which the injected fluid begins to invade the reservoir is the displacement pressure.
- As pressure increases, the proportions of the two fluids gradually reverse until the irreducible saturation point is reached, at which no further invasion by the second fluid is possible at any pressure. Data from these analyses are plotted as capillary pressure curves (figure below).
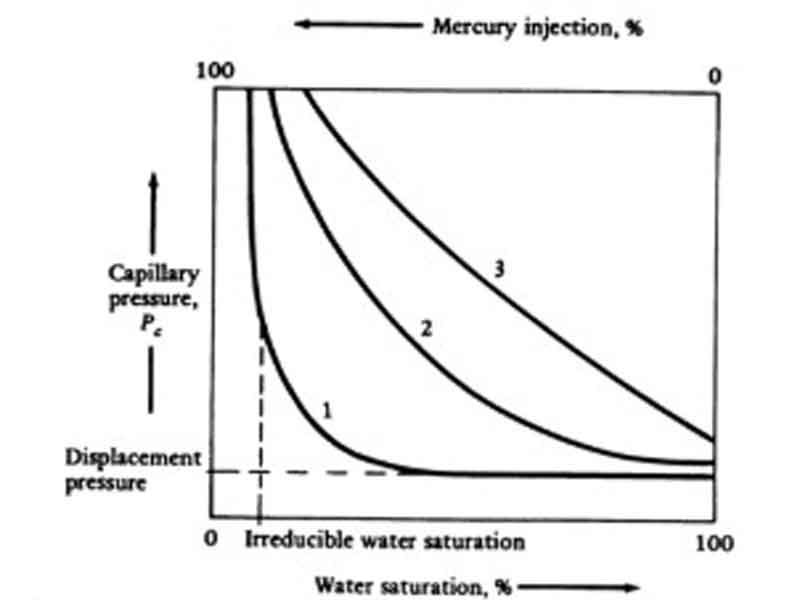
Interpretation of Capillary Pressure Curves:
- Curve 1 is typical of a good reservoir- porous and permeable. Once the entry or displacement pressure has been exceeded, fluid invasion increases rapidly for a minor pressure increase until the irreducible water saturation is reached. At this point, no further water can be expelled irrespective of pressure.
- Curve 2 is for a poorer quality reservoir with a higher displacement pressure and a higher irreducible water content.
- Curve 3 is for a very poor quality reservoir, such as a poorly sorted sand with abundant matrix and, hence, a wide range of pore sizes. Displacement pressure and irreducible water saturation are, therefore, both high, and water saturation declines uniformly with increasing pressure.